
July 27, 2026
PG-LLM: Benchmarking General-Purpose Language Models for Protein Variant Ranking
Full Paper →1Harvard University 2Capable
We thank Dr. Anthony Gitter for feedback on the manuscript and blog post.
General-purpose frontier language models are being increasingly utilized for protein-design work, yet their ability to understand and evaluate variant effects remains unclear. Here, we introduce PG-LLM, a benchmark comprising 276 protein-variant prioritization tasks: 217 from ProteinGym and a temporally held-out set of 59 from recently published studies.
Each task follows the same format: a language model is asked to rank a list of variant sequences given only the wild-type protein sequence and an assay description with no access to tools, multiple-sequence alignments, or protein structures.
The PG-LLM benchmark
PG-LLM evaluates a single task: given an assay objective and a set of variant amino acid sequences, rank variants by their expected experimental performance. The full prompt includes the protein and organism names, a short description of the measured phenotype, the direction corresponding to better performance, the full wild-type sequence, and a shuffled set of full-length mutant sequences. The model must return one JSON ranking variants from highest to lowest predicted assay performance. The prompt does not include the source publication, multiple-sequence alignments, or structure.
A variant set is the list of variants shown in one prompt. To derive these sets, we sort variants within each assay by measured fitness, divide them into ten equally populated bins, and approximately sample the same number of variants from each bin. The resulting variant-set spans the assay’s measured fitness range. We then shuffle the variant order randomly, assign each variant a unique identifier, and display the resulting list in the prompt.
For each assay, we sample three independent variant sets, which we call draws. Draws 1–3 are generated with fixed seeds 1–3. Every LLM and published specialized predictor is evaluated on the same variants for each draw.
We compare returned variant ranks with assay experimental values using Spearman rank correlation. A value of ρ = 1 indicates perfect ordering, whereas ρ = 0 indicates no monotonic rank association. This produces one score for each model, assay, and variant list.
Claude Opus 5 and GPT 5.6 Sol lead the LLM leaderboard but remain below specialist predictors
We use all 217 assays across 186 proteins in the substitution arm of ProteinGym v1.3: 148 assays contain single substitutions and 69 include multi-mutant variants.
We compare against 95 predictors as baselines: 46 sequence-only methods and 49 methods that use alignments and/or structures. For each predictor, we subset scores from ProteinGym to match the same variant-sets in the benchmark. We take these scores and evaluate the resulting order with the same metric and aggregation used for the LLMs. Predictors use the inputs they were designed for, including, for some models, alignments and structures.
The primary leaderboard uses the published ProteinGym nested-macro aggregation. We calculate the score separately for each variant list draw, then average the three draw-specific scores. Within a draw, we average repeated assays within each protein–functional-category cell, average proteins within each functional category, and give equal weight to the five category means. This prevents proteins with many assays or categories with many proteins from dominating the score.
Claude Opus 5 leads the primary N = 50 leaderboard at ρ = 0.406 (SE across 3 draws, 0.002; Figure 1). GPT-5.6 Sol follows closely at 0.402.
Opus 5 outperforms 49 of the 95 published comparators: 41 of 46 sequence-only methods and 8 of 49 methods using an alignment, structure, or both. Opus 5 and GPT 5.6 Sol beat the sequence-only median (ρ = 0.374) but remain below the alignment/structure median (ρ = 0.435). Opus 5 performs well below the best biomolecular model, VenusREM (ρ = 0.523).
Test-time scaling improves performance but gains taper
Higher effort improves Spearman correlation in all four LLMs tested (Figure 2). GPT 5.6 Sol rises from 0.322 ± 0.010 at low effort to 0.394 ± 0.002 at xhigh and 0.402 ± 0.007 at max. Opus 4.8 increases from 0.209 ± 0.003 at low to 0.356 ± 0.011 at max; GPT-5.5 from 0.248 ± 0.013 at low to 0.336 ± 0.008 at xhigh; and Gemini 3.5 Flash from 0.254 ± 0.004 at low to 0.343 ± 0.005 at high.
Gains taper as reasoning effort increases. For further context, a difference of about 0.150 separates the top specialist from the 70th place specialist in ProteinGym.
Why some rankings worked and others failed
Aggregate scores tell us overall performance, but they do not reveal the biological premise that produced it. Models can reach the right answer for a clear biological reason. They can also build a detailed and plausible argument that does not match the experiment.
The seven examples below are grouped into Success, Failure, and Improvement. Success shows a model finding the key biological premise. Failure shows that good observations do not always close the inferential loop. Improvement compares model generations on the same mutations and shows what changed in the reasoning.
Loading qualitative cases…
Source-study recognition is common but not positively associated with accuracy
ProteinGym is public, so models may recognize its source studies. To test the impact of recognition on performance, we audit all leaderboard traces for recognition with Gemini 3.5 Flash as an LLM judge. Traces are marked positively if they identify the source study, dataset, or claim to recall a measured variant result.
Recognition is common but varies by model. It appears in 88% of Sol traces (512/585), 57% of Opus 4.8 traces (324/568), 45% of GPT-5.5 traces (268/595), and 9% of Gemini 3.5 Flash traces (61/651; Figure 4a). Most positive traces name a source study rather than claim recognition of a specific measurement. For example, Opus 5 identifies the NusA stability task as a Tsuboyama et al. 2023 dataset.
For each model and cell, we subtract the mean score of the other three models from that model’s score. This controls for the difficulty of the variant list being evaluated. We then take the residual scores and compare them between recognized and unrecognized traces. The differences are +0.011 for Sol, −0.003 for Opus 4.8, −0.016 for Gemini 3.5 Flash, and −0.051 for GPT-5.5, indicating no consistent positive association between recognition and accuracy.
Source recognition in LLM traces does not show a consistent positive association with ranking accuracy. Models frequently name source studies or datasets, yet recognized traces are not more accurate after controlling for variant-set difficulty. However, this does not rule out training exposure or silent recall, and visible reasoning should not be treated as a fully faithful account of model reasoning.
A post-knowledge-cutoff DMS assay set shows similar trends in performance
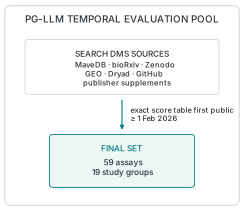
To better control for contamination risk, we construct a post-knowledge-cutoff evaluation set of DMS assays where the exact variant-level score tables became publicly retrievable on or after 1 February 2026. We identify 59 assays from 19 studies that meet this cutoff by searching MaveDB, bioRxiv, Zenodo, GEO, Dryad, GitHub, and publisher supplements (Table S4).
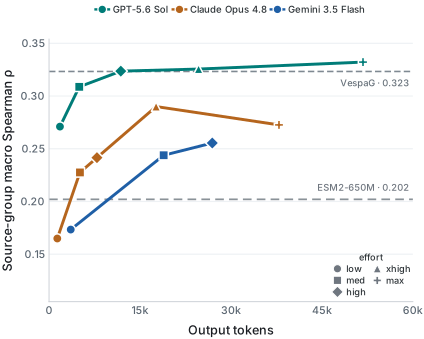
We evaluate GPT-5.6 Sol, Gemini 3.5 Flash, and Claude Opus 4.8 using the same N = 50, no-tools task, with a sweep across reasoning efforts. Studies included are after the knowledge cutoff of Gemini 3.5 Flash and Opus 4.8. 57 of 59 assays also postdate Sol’s 16 February 2026 cutoff.
To prevent results from the same study from dominating the evaluation, we first average scores within each study-group and draw, then average across study-groups. On this set of 59 assays, Sol rises from 0.271 at low effort to 0.332 at max. Opus 4.8 rises from 0.165 at low to 0.290 at xhigh, then reaches 0.273 at max. Gemini 3.5 Flash rises from 0.173 at low to 0.255 at high. Despite lower absolute scores compared to ProteinGym assays, LLMs perform better relative to biomolecular comparators, with GPT 5.6 Sol (Max) scoring better than ESM2-650M (0.202) and being approximately on par with VespaG (0.323).
Discussion
PG-LLM shows that frontier LLMs place near the median of specialized protein predictors. Claude Opus 5 and GPT 5.6 Sol perform the best of all LLMs evaluated, with Opus 5 outperforming 49 of the 95 published comparators despite receiving only an assay description and full-length sequences. Current LLMs can reason well about a small set of variants, but reasoning becomes harder as the number of comparisons grows, consistent with evidence that LLMs use long contexts unevenly. As models become more capable at the N = 50 setting, we plan to scale the benchmark standard to N = 100, then N = 500, and eventually to ranking every measured variant in each assay.
PG-LLM evaluates controlled variant sets rather than complete assays. The primary benchmark uses three samples of 50 variants per assay, while the standard ProteinGym benchmark scores each method over the full measured substitution set. Therefore, absolute values of scores discussed here are not interchangeable with ProteinGym scores.
LLMs are only given natural-language context and do not receive alignments or structures. Future experiments should test the addition of alignments, structures, or protein-analysis tools to test whether language models can integrate the evidence that currently gives specialist systems their advantage.
Citation Rohit Krishan Arora, Leo Tianlai Chen, Melissa Du, Debora Marks, and George Church. PG-LLM: Benchmarking General-Purpose Language Models for Protein Variant Ranking. bioRxiv (2026). doi:10.64898/2026.07.27.741045